Frequently Asked Questions
General
When I load the tool tab, the browser is blank or shows nonsense (code). What should I do?
We have tested the tool using a variety of platforms and browsers to prevent this. However, browsers change their code regularly so errors may occur from time to time. First, we would suggest you scroll down in your browser. Generally, when this error has occurred in the past, the tool displayed correctly further down in the browser window. However, we also ask you to email us to let us know of this error. Please include your platform (Mac or PC) as well as browser name and version in the email. We will do our best to make a correction.
I clicked my browser's refresh button. The tool is showing the correct selections in the drop-down menu boxes but the entry tables and/or data are not displaying correctly. What is going on?
Clicking "refresh" on your browser restores the default settings on the page, but does not change the selections you have made in the drop-down menus. You can correct this by changing your drop-down menu selections and then returning them to your desired selection. In the future, do not click the "refresh" button when using the WESTWeb tool.
I would like to manipulate the results to create a custom table or chart. How can I do this?
We recommend you copy the results from WESTWeb and paste them into a spreadsheet program, such as Excel. Be sure to select the entire table so that the data pastes properly. If it is not pasting into separate cells correctly, try also selecting some text above and below the table. That has generally worked for us. You can also use this method to compare results from multiple "runs" of WESTWeb if additional analyses are needed.
I would like to analyze the operations of my utility and also analyze some variations on components. How can I do this using WEST?
You will need to run these as separate scenarios. Scenario 1 may be for your entire utility and the data entered should include all components you are interested in. For Scenario 2, you can enter the subset of the data that you want to focus on in detail. A third scenario may change some details from Scenario 2 to compare an alternative design or operational strategy. If you need to analyze more than 5 scenarios, copy the results from your first five analyses into a spreadsheet program and start over with WESTWeb.
Infrastructure
What are the pipe costs used to estimate the pipe production material impacts? How can I adjust them if my costs are significantly different?
The default costs for piping materials are taken from the Means guide. The table below summarizes the cost data use.
| Material | Diameter (inch/cm) | Default cost (2002$ per foot) | Notes |
|---|---|---|---|
| Concrete | 12 / 30.5 | $13.20 | --- |
| Concrete | 30 / 76 | $67.75 | --- |
| Concrete | 48 / 122 | $102.00 | For simple entry, assumed material and diameter for simple entry for water system supply pipe and wastewater system discharge pipe. |
| Metal | 12 / 30.5 | $15.10 | For simple entry, assumed material and diameter for simple entry for water system distribution pipe and wastewater system collection pipe. | Metal | 30 / 76 | $46.50 | --- |
| Metal | 48 / 122 | $98.00 | --- |
| Plastic | 12 / 30.5 | $17.05 | For simple entry, assumed material and diameter for all treatment pipe. | Plastic | 30 / 76 | $122.00 | --- | Plastic | 48 / 122 | $61 | Assumed for corregated sewer pipe |
However, we recognize there is wide variability in costs depending on the site conditions and operating parameters for the system. For the most accurate analysis, calculate the total costs for each category of material and diameter (in 2002$) for your system and divide it by the default cost to obtain a revised "length" that can be used in your analysis. Be sure to convert if you are using metric units.
Operation
The default emission factors for my energy source are not representative for my system. What can I do?
Consider using the full versions of WEST and WWEST to conduct your analysis. Both tools allow the user to enter custom emission factors for electricity and other energy sources. Also, if you have data that shows that our assumptions may not be representative for other cases, email that to the developers and we will consider updating the tool with new data. Technologies change all the time and we would love WESTWeb to stay current.
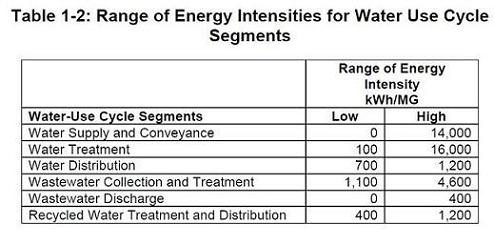
I am entering data about a water system that is not yet in place. Can you provide guidance about realistic electricity consumption estimates?
There is a lot of variability in the electricity consumption of these systems depending on factors such as system design, process selection, system scale, topography, etc. That said, the California Energy Commission published a table of the expected ranges for systems in California that we have found helpful to bound our assumptions.
My wastewater system has multiple sources of methane (e.g., from both liquid treatment and sludge digestion). WESTWeb only allows me to analyze one. Which should I choose?
You have a few options. First, you could only analyze the largest of methane, if other contributors are minor. Generally speaking, unless they are very poorly managed, aerobic treatment processes are not a significant source. If that does not accurately model your system, you can run the model for each of the contributing process and sum the process results. This method will double-count the nitrous oxide emissions, but these are negligible if methane emissions are not well controlled. Another option is to use the full WWEST model to estimate your process methane emissions. WWEST allows the user to analyze multiple methane sources in the system at the same time.