Navigation list
- Project History
- WESTWeb
- Need help?
- Glossary
- Acronyms and Abbreviations
- Calculations
- Infrastructure Calculations
- Operation Calculations
- Waste Management Calculations
- Sample Analysis Entry and Results
- Basic Wastewater Analysis for Two Systems
- Detailed Water Analysis for a Single Utility
- Sources
- Publications
- Update Log
Project History
WESTWeb provides a simple framework to apply life-cycle thinking to water and wastewater systems. It specifically focuses on the life-cycle effects of manufacturing major infrastructure components (piping, structures, some process equipment), producing treatment chemicals, providing energy from electricity, natural gas, gasoline, and diesel, and, for wastewater only, disposing of sludge and generating methane in the treatment process directly. WESTWeb provides results for energy consumption and greenhouse gas emissions, as well as other environmental impacts (e.g., human toxicity, terrestrial and aquatic eco-toxicity, and respiratory effects). WESTWeb is discussed in more detail below.
WESTWeb was developed as a part of a multi-year research contract. WESTWeb is a pared-down and combined version of the Water-Energy Sustainability Tool (WEST) and the Wastewater-Energy Sustainability Tool (WWEST) which were also developed as part of this research. WEST and WWEST are discussed briefly below. See the WEST tab for more detailed description and to find out how to obtain copies of these tools.
- WEST was developed to evaluate the life-cycle energy and environmental effects of potable and recycled water systems. Like WESTWeb, it evaluates infrastructure and chemical manufacturing as well as energy production. However, it allows the user to evaluate a broader range of material inputs than WESTWeb. It also allows the user greater flexibility when analyzing electricity and fuel production. For instance, in WEST, the user can customize the emission factors used for electricity and can analyze alternative fuels, such as ethanol and biodiesel. In addition, WEST can analyze the impacts of transporting materials via truck, train, or plane and the emissions from equipment used in construction and maintenance activities. A limited analysis of waste disposal is also included in WEST. The input data for WEST is generally material costs (in 1997$), although some chemicals should be in entered in units of mass (kg). Results are reported in units megajoues (MJ) of energy and mass (g) of particular emissions to air and water.
- WWEST is intended to quantify similar life-cycle effects of wastewater systems. It evaluates infrastructure and chemical manufacturing and energy production. However, unlike WESTWeb, it allows the user to evaluate a broader range of material inputs. It also allows the user greater flexibility when analyzing electricity and fuel production (see WEST discussion above for examples) and allows users to calculate offsets for energy that may be generated through their treatment process. Like WEST, WWEST can analyze the impacts of transporting materials, emissions from construction and maintenance, and the effects of waste disposal. The input data for WWEST is generally material costs (in 1997$), although some chemicals should be in entered in units of mass (kg).WWEST includes default estimates of infrastructure and energy requirements for certain treatment processes. Results are reported in units MJ of energy and g of particular emissions to air and water.
Acknowledgements
WEST, WWEST, and WESTWeb were developed at the University of California at Berkeley Department of Civil and Environmental Engineering with funding from the California Energy Commission Public-Interest Energy Research (PIER) program. The developers, Dr. Jennifer Stokes and Prof. Arpad Horvath, would like to acknowledge Dr. Mike Chester for programming WESTWeb and Joe O'Hagan of the Energy Commission for shepherding this project.
This research results from work sponsored by the California Energy Commission (Energy Commission) and University of California (UC). It does not necessarily represent the views of the Energy Commission, UC, their employees, or the State of California. The Energy Commission, the State of California, its employees, and UC make no warranty, express or implied, and assume no legal liability for the information in this work; nor does any party represent that the use of this information will not infringe upon privately owned rights. This work has not been approved or disapproved by the Energy Commission or UC, nor has the Energy Commission or UC passed upon the accuracy or adequacy of the information in this work.
WESTWeb
WESTWeb is not a conventional greenhouse gas inventory tool which calculates the emissions from generating electricity and burning fuels. One example of an inventory methodology is from the California Climate Action Registry. In WESTWeb, the supply chain for every process evaluated is taken into consideration. What does that mean? For example, when you evaluate electricity production from renewable energy, say, solar photovoltaics, the effects of manufacturing the solar panel are included in the results, as well as the effects of mining, processing, transporting, and manufacturing all of its component parts. Similarly for concrete, the effects of mining aggregate, providing water, processing cement, a particularly greenhouse gas-intensive process, and transportation, as well as other supply chain impacts are included. How do we track all those inputs and do those calculations? You can find more information on the methodology on the LCA tab.
Suggested Users and Uses
WESTWeb can be used by water system designers, utility operators, civil engineers, regulators, and researchers. Users should have a working knowledge of water supply or wastewater system, data related to a real or hypothetical water or wastewater system, and a desire to learn more about the environmental implications of their decisions.
It can be used to answer a variety of questions about water and wastewater systems including:
- WATER SOURCE SELECTION: To provide additional water, is it preferable to build a new pipeline, construct a new reservoir, desalinate water from a new source, or implement a recycled water program?
- PROCESS SELECTION: Is it preferable to implement membrane or traditional filtration? How do the effects of conventional and natural wastewater treatment processes compare? How much would results change if I switched out two chemicals in the treatment process?
- OPERATIONAL OPTIMIZATIONS: Which of the treatment plants operated by my utility minimizes my greenhouse gas emissions?
- ENERGY SOURCE SELECTION: What percentage of the environmental effects associated with electricity use? What is the contribution of other energy sources? What if all our electricity came from solar power, how much would that reduce emissions?
- DISPOSAL OPTIONS: How might my solids disposal choice affect my greenhouse gas (or other) emissions?
This list of questions is not comprehensive but gives an idea of the types of issues that WESTWeb can be used to evaluate. The full versions of WEST and WWEST can be used for more detailed analysis.
Want to help us?
The developers are compiling case studies of water and wastewater systems of varied designs, scale, and geography. If you are willing to share your data and results, please email us. We can maintain anonymity for your utility, if needed. Please also send comments or suggestions for the tools. Unfortunately, because this project is no longer funded, we cannot guarantee a response. We will do our best to respond as our schedule allows.
Need Help?
The following information on getting help with WESTWeb is always available in the left pane on every tab for easy reference.
1) On the Tool tab, scroll over items underlined in red for brief guidance.
2) For a detailed WESTWeb info, see Background.
3) For frequently asked questions about WESTWeb, see FAQs.
4) For more on the life-cycle assessment (LCA) methodology, see LCA.
5) For a more complete LCA tool for water/wastewater, see WEST model.
6) If necessary, contact the developers. Note: customer service for this tool is not guaranteed.
Glossary
Aquatic acidification: A midpoint category that evaluates all the results which affect the acidity of surface water. It is reported in units of mass-equivalents of SO2 into air. In the IMPACT2002+ model, aquatic acidification contributes to the Ecosystem Quality damage category.
Aquatic ecotoxicity: A midpoint category that evaluates all the results which affect the toxicity of surface fresh water (streams and lakes). It is reported in units of mass-equivalents of TEG into water. In the IMPACT2002+ model model, aquatic ecotoxicity contributes to the Ecosystem Quality damage category.
Aquatic eutrophication: A midpoint category that evaluates all the emissions (e.g., nitrates and phosphates) which contribute to phytoplankton growth and depleted oxygen in water. It is reported in units of mass-equivalents of PO43- into air. In the IMPACT2002+ model, aquatic eutrophication contributes to the Ecosystem Quality damage category.
Carcinogenic effect: A midpoint category that estimates chronic and cancer-causing toxicological human health effects. It is reported in units of mass-equivalents of chloroethylene into air. In the IMPACT2002+ model, carcinogenic effect is a component of human toxicity and contributes to the Human Health damage category.
Collection: A wastewater system process phase that includes all components and energy required to obtain raw sewage from customers and transport it to the treatment facility.
Construction: The lifecycle phase that includes all activities associated with the material production, transport, equipment operation, and energy used to initially build and/or install the water or wastewater system.
Damage category: The final product of the impact assessment stage of LCA. It is calculated based on results of one or more midpoint categories.. In the IMPACT2002+ model framework, damage categories include human health, ecosystem quality, climate change, and resources. WESTWeb does not report results for damage categories but these can be determined based on WESTWeb's midpoint category results.
Discharge: A wastewater system process phase that includes all infrastructure and energy used to transport treated water to its discharge location.
Distribution: A water system process phase that includes all infrastructure and energy used to transport treated water to customers.
Functional Unit: Generally, this is the unit of output that provides the basis upon which all alternatives are compared. It should be scaled to be appropriate to all scenarios. In WESTWeb, the functional unit is a volume of water or wastewater processed (in gallons or liters). The default value is 1,000,000. The units are either gallons or liters, depending on the user's units selection. When selecting a functional unit for the analyis, it can be, but does not necessarily need to be, related to your system. If you wish, you could use the system's average daily or annual output volume as the functional unit. In that case, the results could be reported as the grams of emissions per day or per year. Alternately, it can be defined as an easily scalable value (e.g., 1,000,000). The results of a particular scenario are assumed to be scalable based on the volume of water produced so if you have results for 1,000,000 liters, you can multiply results by 2 to get the results for producing 2,000,000 liters in the same system using the same assumptions.
Greenhouse gases: A midpoint category that evaluates all the results which contribute to climate change. It is reported in units of mass-equivalents of CO2 into air. In the IMPACT2002+ model, greenhouse gases, or global warming effect, contributes to the Climate Change damage category.
Human toxicity: A midpoint category that represents the sum of carcinogenic and non-carcinogenic effects. It is reported in units of mass-equivalents of chloroethylene into air. In the IMPACT2002+ model, human toxicity contributes to the Human Health damage category.
Infrastructure: A life-cycle phase used in WESTWeb that combines construction and maintenance of infrastructure. It includes material production (e.g., piping, concrete structures, and if detailed entry is selected, valves, flowmeters, pumps, and treatment process equipment). Installation and construction equipment use is not evaluated but can be evaluated using WEST or WWEST.
Life-cycle assessment: A systematic methodology developed to quantify the inventory of energy and materials used in the life-cycle of a product or process and translate those into environmental impacts. For more information, see LCA tab.
Life-cycle phase: Data entry in WESTWeb is structured according to life-cycle phase. Results from WESTWeb also are reported according to the life-cycle phase. The life-cycle phases include infrastructure (e.g., construction and maintenance), operation, and waste management.
Maintenance: The lifecycle phase that includes all activities associated with the material production, transport, equipment operation, and energy used in replacing or repairing capital components of the water or wastewater system. Non-capital materials (e.g., chemicals) are included in the operation phase.
Midpoint categories: Results of a step in the impact assessment where chemical emissions with related health and/or environmental impacts are reported in terms of mass-equivalents of a reference substance appropriate for that category. For example, all greenhouse gases (e.g., carbon dioxide, methane, nitrous oxide) are reported in terms of CO2 equivalents. Midpoint categories can be used to determine final damage categories.
Non-carcinogenic effects: A midpoint category that estimates chronic and non-cancer-causing toxicological human health effects. It is reported in units of mass-equivalents of chloroethylene into air. In the IMPACT2002+ model, non-carcinogenic effect is a component of human toxicity and contributes to the Human Health damage category.
Operation: A life-cycle phase that includes electricity and fuel use, chemical production, and, for wastewater, direct emissions from the treatment process.
Ozone depletion: A midpoint category that evaluates all the results which contribute to reduction in stratospheric ozone concentrations which can lead to increased incidence of skin cancer and other effects. It is reported in units of mass-equivalents of CFC-11 into air using data from the US EPA's Ozone Depletion Potential List. In the IMPACT2002+ model, ozone layer depletion contributes to the Human Health and Ecosystem Quality damage category.
Process equipment: Refers to the equipment used in the treatment process and may include pumps, motors, filter media, flocculation or disinfection basins, chemical dosing equipment, storage tanks, dewatering equipment, etc.
Process phase: Results from WESTWeb are reported according to the process phase. For water systems, the process phases include supply, treatment, and distribution. For wastewater systems, the process phases are collection, treatment, and discharge.
Respiratory inorganics: A midpoint category that evaluates all the results of particulate matter (dust) in the environment. It is reported in units of mass-equivalents of PM2.5 into air. PM2.5 includes all particles less than 2.5 microns in diameter. In the IMPACT2002+ model, respiratory inorganics contributes to the Human Health damage category.
Respiratory organics: A midpoint category that evaluates all the results which contribute to photochemical oxidation (smog creation). It is reported in units of mass-equivalents of ethylene into air. In the IMPACT2002+ model, respiratory organics contributes to the Human Health and ecosystem quality damage category.
Supply: A water system process phase that includes all components and energy required to obtain raw water from the source and transport it to the treatment facility.
Supply chain: The network of manufacturers, distributors, and transportation services that enable a product to reach its consumer.
Terrestrial acidification and nutrification: A midpoint category that estimates the effects of chemicals that increase acidity and similar impacts to terrestrial ecosystem. It is reported in units of mass-equivalents of SO2 into soil. In the IMPACT2002+ model, terrestrial acidification and nutrification contributes to the Ecosystem Quality damage category.
Terrestrial ecotoxicity: A midpoint category that estimates the effects of ecotoxic substances working through the aqueous phase in soil. It is reported in units of mass-equivalents of TEG into soil. In the IMPACT2002+ model, terrestrial ecotoxicity contributes to the Ecosystem Quality damage category.
Treatment: A water and wastewater system process phase that includes all infrastructure, energy, and chemical use needed to meet regulatory requirements. Treatment may occur at a central treatment plant or in a more distributed manner (i.e., at wellheads for water systems).
Waste management: A life-cycle phase for wastewater systems that includes disposal of sludge. Additional waste management options are available in WEST or WWEST.
Acronyms and Abbreviations
AqAc = Aquatic acidification
AqEc = Aquatic ecotoxicity
AqEu = Aquatic eutrophication
BOD = Biochemical (or biological) oxygen demand
C2H3Cl = Chloroethylene
C2H4 = ethylene
Car = Carcinogenic effects
CCAR = California Climate Action Registry
CFC = Chlorofluorocarbon
CH4 = Methane
cm = centmeters
CO = Carbon monoxide
CO2 = Carbon dioxide
CO2e = Carbon dioxide equivalents
EFs = Emission factors
EIO-LCA = Economic Input-Output Life-cycle Assessment
EN = Energy production
FU = Functional Unit
g = grams
GHG = Greenhouse gas
in = inch
IPCC = International Panel on Climate Change
ISO = International Organization for Standardization
kg = kilograms
LADWP = Los Angeles Department of Water and Power, a California electric utility
lb = pounds
LCA = Life-cycle assessment
mg = milligrams
MMBTU = Million BTUs
MWh = Megawatt-hour
NCar = Non-carcinogenic health effects
NOx = Nitrogen oxides
OxDe = Ozone depletion
PAHs = Polycyclic aromatic hydrocarbons
PG&E = Pacific Gas and Electric, a California electric utility
P-lim = Phosphate-limited environment
PM2.5 = Particulate matter, less than 2.5 microns in diameter
PM10 = Particulate matter, less than 10 microns in diameter
PO43- = Phosphate
ReIn = Respiratory inorganics
ReOr = Respiratory organics
SCE = Southern California Edison, a California electric utility
SDG&E = San Diego Gas and Electric, a California electric utility
SMUD = Sacramento Municipal Utility District, a California electric utility
SO2 = Sulfur dioxide
TeEc = Terrestrial ecotoxicity
TeAN = Terrestrial acidification and nutrification
TEG = Triethylene glycol
UC = University of California
UV = Ultraviolet
VOC = Volatile organic compounds
WEST = Water-Energy Sustainability Tool
WWEST = Wastewater-Energy Sustainability Tool
Yr = year
Calculations
There are several basic calculations that are performed by WESTWeb. The descriptions below are organized by life-cycle phase: Infrastructure, Operation, and Waste Management.
Infrastructure
Most material production calculations, including all infrastructure and the "other chemicals" in the operation phase, use EIO-LCA emission factors (EF). The equation is used for materials that are replaced when their service life ends is:
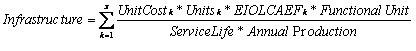
The unit cost for each material in 2002$ is embedded in WESTWeb and cannot be changed. A default cost for all pipe materials and diameters, as well as for ready-mix concrete and reinforcing steel, used in the tool are taken from (Means 2004) and is used to convert the entered values to cost. The Units are entered by the user generally in 2002$. Pipe units are entered in length and reinforced concrete is entered in volume. The material EFs are from EIO-LCA. The functional unit and annual production volume are entered by the user. The service life for materials can be edited, though the user may need to select the detailed entry option to do so.
Operation
Operational impacts primarily consist of energy consumption and treatment chemical production. For wastewater, it also includes process emissions.
Energy Consumption Calculations
The general equation for the environmental effect of fuel is as follows:
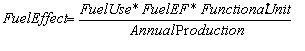
Fuel use (in MWh for electricity, MMBTU for natural gas, and gallons or liters for gasoline and diesel), functional unit, and annual production for each scenario are entered by the user. The sources for each fuel source (electricity, natural gas, gasoline, and diesel) is described below.
Electricity: The electricity EFs use data from EPA's E-GRID database to determine the direct emissions from fossil fuels combined with estimates of the upstream emissions (i.e., supply-chain) collected from relevant literature. See the Energy Commission's final report for this project for more information. If a custom energy mix is entered, the EF is the sum of the contribution multiplied by the EF for each fuel.
Natural gas: The natural gas EFs are also from combined sources. The direct emissions are estimated with EPA's AP-42 data. Upstream effects are estimated using EIO-LCA's "Oil and natural gas extraction" sector.
Gasoline and diesel: The fuel EFs are taken from the Department of Energy's GREET model. For greenhouse gases, the EF is revised using information from the California Climate Action Registry.
Treatment Chemical Production Calculations
For specifically listed chemicals, the equation for calculation each environmental effect is:
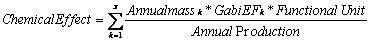
The EFs for each chemical k comes from the GaBi software and are reported in terms of mass (emissions per kg). The annual mass of chemicals used, functional unit, and annual production for the scenario are entered into WESTWeb by the user.
For non-specifically listed chemicals (i.e., "other chemicals"), the EF is from EIO-LCA and is reported in terms of 2002$. The equation used for that calculation is similar to the equation provided in the infrastructure section though, because the purchase is made annually, the service life term is not included in the equation.
Wastewater Treatment Process GHG Calculations
When wastewater is treated, it is possible for GHGs to be created. The primary sources is methane (CH4) created through anaerobic treatment, sometimes by design or due to poor-management of aerobic treatment. Nitrous oxide (N2O) can also be produced. The GHG emissions from wastewater treatment are estimated using the methodology defined by the International Panel on Climate Change (IPCC). The equations used to calculate total annual CH4 and N2O emissions are below.
Methane

The CH4Process EF (in g CH4 per g BOD treated in the process) is specific to the treatment process (or processes) used at the plant. WESTWeb includes EFs for well-managed centralized aerobic treatment, poorly-managed centralized aerobic treatment, anaerobic digesters, anaerobic reactors, anaerobic shallow lagoons, anaerobic deep lagoons, and septic systems. The tool uses the recommended defaults from IPCC. The influent BOD concentration (in mg/L), annual production (entered in or converted to liters), sludge BOD (in mg/kg), volume of sludge disposed (entered in or converted to kg), and CH4 capture rate (%) are all based on user entry. The factor of 1000 in the denominator converts mg to g.
Nitrous oxide

The N2O process EF (in g per person per year) is 3.2, per IPCC. The Industrial Contribution estimates the effect of non-residential contributors to wastewater and includes commercial and institutional customers as well. The IPCC-recommended default value of 1.25 is used in WESTWeb. The population served is entered by the user.
Total GHGs
After the CH4 and N2O annual emissions are calculated, the following equation is used to determine the weighted GHG emissions.
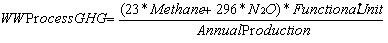
The factors, 23 and 296, are the 100-year global warming potentials for methane and nitrous oxide, respectively, from IPCC. The functional unit and annual production for each scenario are user-entered.
Wastewater Waste Management
The following equation is used to calculate the waste management environmental effects associated with wastewater sludge.
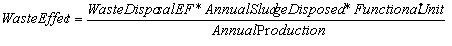
The life-cycle EFs that estimate waste management impacts include the long- term emissions of disposal or reuse of wastewater sludge as well as processing and transport emissions. Except for landfill disposal, the EFs are from (Murray et al 2009). Landfill EFs are calculated by the WESTWeb developers as described in (Horvath 2011). The annual volume of sludge disposed is entered in the process emissions section. The functional unit and annual production for each scenario are also user-entered.
If the user selects incineration as their disposal process, they should select a secondary ash disposal process for more complete analysis.
Sample Analysis Entry and Results
Sample analysis files are in PDF format. Please ensure you have the proper software to view them.
Basic wastewater entry for two systems
Click here to see sample entry for a wastewater utility and neighborhood septic system using all basic entry and results options.
Detailed water entry for a utility
Click here to see sample entry for a water utility using detailed entry and results options.
Sources
American Institute of Architects (1997). Environmental Resource Guide John Wiley and Sons.
California Climate Action Registry (2009). General Reporting Protocol: Reporting Entity-Wide Greenhouse Gas Emissions. Version 3.1. January.
California Energy Commission (2005). California's Water Energy Relationship. November. CEC-700-2005-11-SF.
Carnegie Mellon Green Design Institute. (2011). "Economic Input Output Life Cycle Assessment (EIOLCA)." Retrieved January, 2011.
Graedel, T.E. and B. Allenby (2003). Industrial Ecology. Prentice-Hall: Upper Saddle River, N.J.
Intergovernmental Panel on Climate Change (2006). 2006 IPCC guidelines for national greenhouse gas inventories.
ISO (1997). Environmental management- Life cycle assessment- General principles and framework. Geneva, Switzerland, International Organization for Standardization.
Jolliet O, Margni M, Charles R, Humbert S, Payet J, Rebitzer G, Rosenbaum R (2003). "IMPACT 2002+: A New Life Cycle Impact Assessment Methodology." International Journal of LCA 8(6):324-330.
Means (2004) Heavy Construction Cost Data, 12th ed. R.S. Means Corporation: Kingston, MA.
Murray, A., A. Horvath, and K. Nelson (2008). "Hybrid Life-cycle Environmental and Cost Inventory of Sewage Sludge Treatment and End-Use Scenarios: A Case Study from China" Environmental Science and Technology, 42(3163-3169).
PE International. (2005). "GaBi Software." Released March 20, 2003.
Quantis (2012). IMPACT2002+_UserGuide_for_vQ2 21_1November2012. IMPACT Modeling Team. Retrieved November 2018.
Risk Science Center (2011). Risk and Impact Modelling IMPACT 2002+. University of Michigan. Retrieved February 2011.
SETAC (1991). A Technical Framework for Life Cycle Assessment. Society of Environmental Toxicology and Chemistry Workshop report, Smugglers Notch, Vermont, 1991.
US Department of Energy (2009). Greenhouse Gases, Regulated Emissions, and Energy Use in Transportation (GREET) Model. Argonne National Laboratory, Version 1.8c.0. Retrieved February 15, 2010.
United States Environmental Protection Agency (2001). "Compilation of Air Pollutant Emission Factors, AP-42," Fifth Edition, Volume 1, Research Triangle Park, NC, 2001 and updates through September 2002.
United States Environmental Protection Agency (2018). "The Emissions and Generation Resource Integrated Database (E-GRID2016), 2016 Data (Released February 15, 2018)". Retrieved November 2018.
Publications
Stokes, J. (2004). Life-cycle Assessment of Alternative Water Supply Systems in California. Unpublished Ph.D. dissertation. University of California, Berkeley, California. May.
Horvath, A. (2005). Life-cycle Energy Assessment of Alternative Water Supply Systems in California. California Energy Commission, PIER Energy-Related Environmental Research. CEC-500-2005-101.
Stokes, J. and A. Horvath (2006). "Life Cycle Energy Assessment of Alternative Water Supply Sources" International Journal of Life Cycle Assessment, (5) 335-346.
Stokes, J. R. and A. Horvath (2009). "Energy and Air Emission Effects of Water Supply." Environmental Science & Technology 43(8): 2680-2687.
Stokes J. & A. Horvath (2010). "Supply-chain environmental effects of wastewater utilities." Environmental Research Letters 5(1): 014015.
Stokes, J. and A. Horvath (2011). " Life-Cycle Assessment of Urban Water Provision: Tool and Case Study in California." Journal of Infrastructure Systems 17(1).
Horvath, A. (2011). Life-cycle Energy Assessment of Alternative Water Supply Systems in California- Extensions and Refinements. California Energy Commission, PIER Energy-Related Environmental Research. In progress.
Update Log
The following table is updated whenever substantive changes to this webpage are made. Minor and/or textual edits may not be listed here.
| Date | Tab edited | Description of change |
|---|---|---|
| May 31, 2011 | None | Initial tool release |
| June 14, 2011 | Web tool | Added options for scientific notation; clarified entry units within infrastructure tables; corrected subtotal results display for concrete infrastructure |
| July 18, 2011 | Background | Added two sample results files |
| October 10, 2018 | EGRID EFs | Updated EGRID data with 2016 values |
| November 10, 2018 | EGRID EFs | Updated major California utility (electricity mix) data with 2016 values |
| November 18, 2018 | China Electricity Generation EFs by Province for 2020 | Added China 2020 electricity generation projection data for provinces by Li et al.(2018) study |
| November 19, 2018 | China National Electricity Generation EF Projections for 2016-2050 | Added China national electricity generation EF projection data for 2016-2050 period, estimated by LBL(2018) |
| November 25, 2018 | Revision of Treatment Chemical Production Impact Category Factors | Chemicals Added: Calcium Carbonate, Calcium Hydroxide, Carbon dioxide, Phosphoric Acid (100%), Phosphoric Acid (75%), Potassium Hydroxide, Soda Ash, Ferrous Sulphate, Anhydrous Ammonia (NH3), Sodium Hypochlorite, Hydrogen Fluoride, Sodium Chloride (NaCl), Zeolite, Methanol, Sodium Bisulfite; Chemicals Updated: Hydrochloric Acid (HCl), Sulphuric Acid, Lime, Sodium Hydroxide (Caustic soda), Chlorine, Calcium Hypochlorite, Ozone, Aqueaous Ammonia; Chemicals with No Change: Aluminum Sulfate, Aluminum Hydroxide, Ferric Chloride, Polymers, Fluorosilicic Acid, Others |